It is difficult to understate the importance of data visualization in astronomy and astrophysics. Behind every great discovery, there is some simple visualization of the complex data that makes the science behind it seem obvious. As good at computers are becoming at making fits and finding patterns, the human eye and mind are still unparalleled when it comes to detecting interesting patterns in data to reach new conclusions. Here are a few of my favorite visualizations that simply illustrate complex concepts.
Large Scale Structure
As we’ve mapped increasing portions of the known universe, we’ve discovered astounding structures on the largest scales. Visualizing this structure in 2D or 3D maps gives us an intuitive grasp of the arrangement of galaxies within the universe and the forces the creation of that structure.
Galaxy filaments
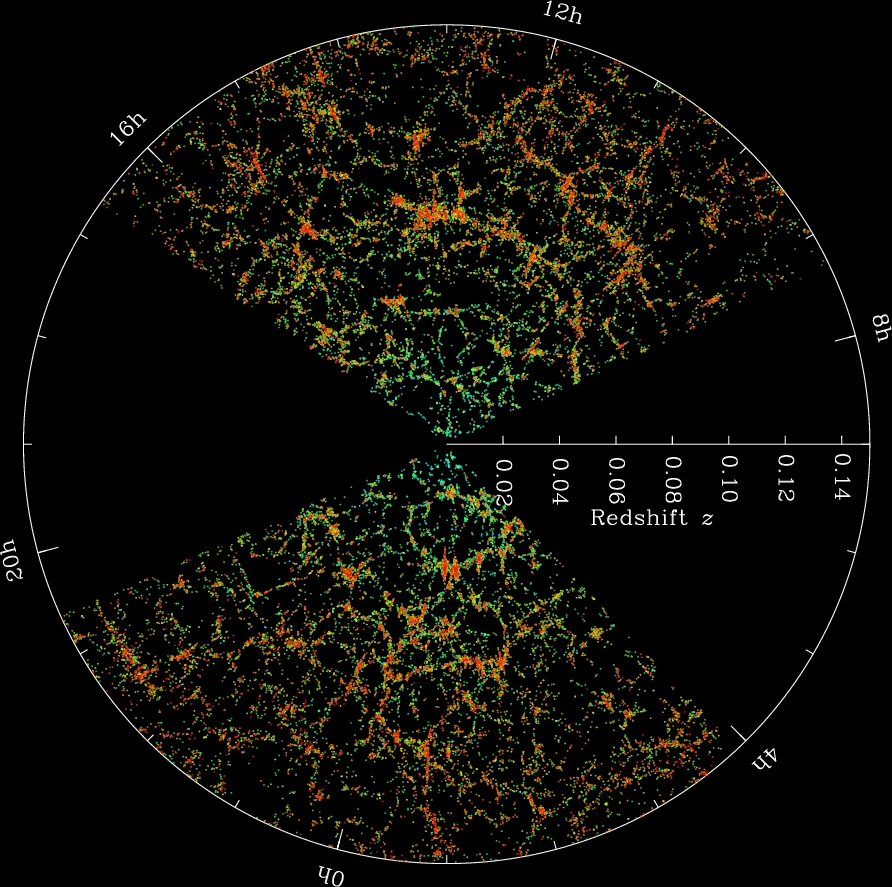
The Sloan Digital Sky Survey is a massive scientific undertaking to map objects of the known universe. Hundreds of millions of objects have been observed going back billions of years. It may seem overwhelming to even begin processing this data, but a simple map of the objects in the sky provides immediate insight into the large scale structure of our universe. We find that galaxies are bound by gravity to form massive filaments, and that these filaments must contain mass beyond what we can see (in the form of dark matter) to form these web-like structures.
Fingers of God

If you plot galaxies to observe large-scale structure, a peculiar pattern emerges. The structures seem to point inward and outward from our position in the universe. This violates the Cosmological Principle, which states that no position in the universe should be favored over any other. So why do these filaments seem to point at us? The cause of these “Fingers of God” is an observational effect called redshift-space distortion. The galaxies are moving due to larger gravitational forces of their cluster, as well as the expansion of the universe, so their light seems to be accelerated towards or away from us. Correcting for this effect gives us the more random filaments we see above.
Expansion of the Universe
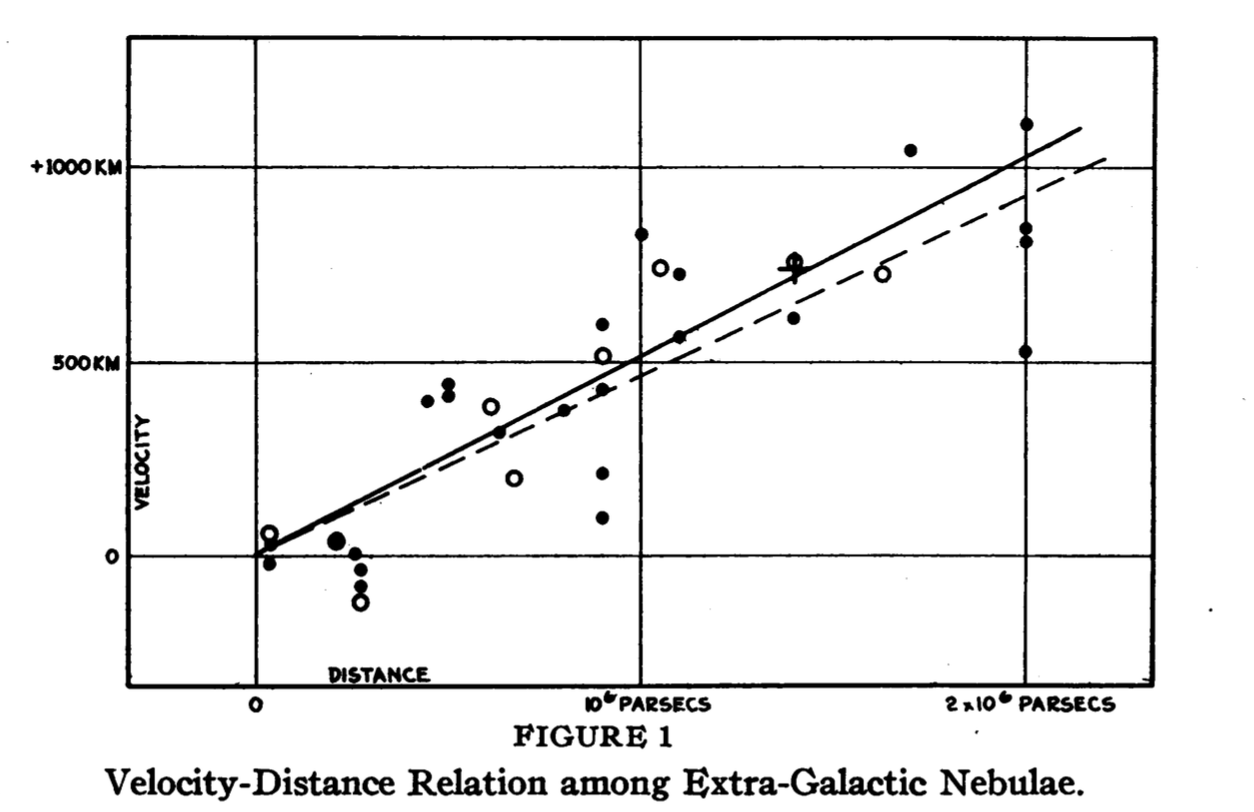
In 1929, Edwin Hubble published a simple yet revolutionary plot. He plotted the distance of galaxies from us, and the velocities at which they moved toward or away from us. What he found was that the farther away a galaxy was, the faster it moved away from us. This could not be the case in what was thought to be a static universe. Hubble’s Law came to prove that our universe was in fact expanding.
Galaxy Rotation Curves
When we plot the rotational velocity of galaxies, we expect the rotational velocity to fall off as the radius increases based on the mass we can observe. As we get further away from the center and into less-dense regions, the matter should lose angular momentum and rotate slower. However, plotting rotational velocity curves reveals something peculiar — the rotational velocity remains constant regardless of radius as you leave the center. This means there must be matter we aren’t seeing: dark matter.
Our own research
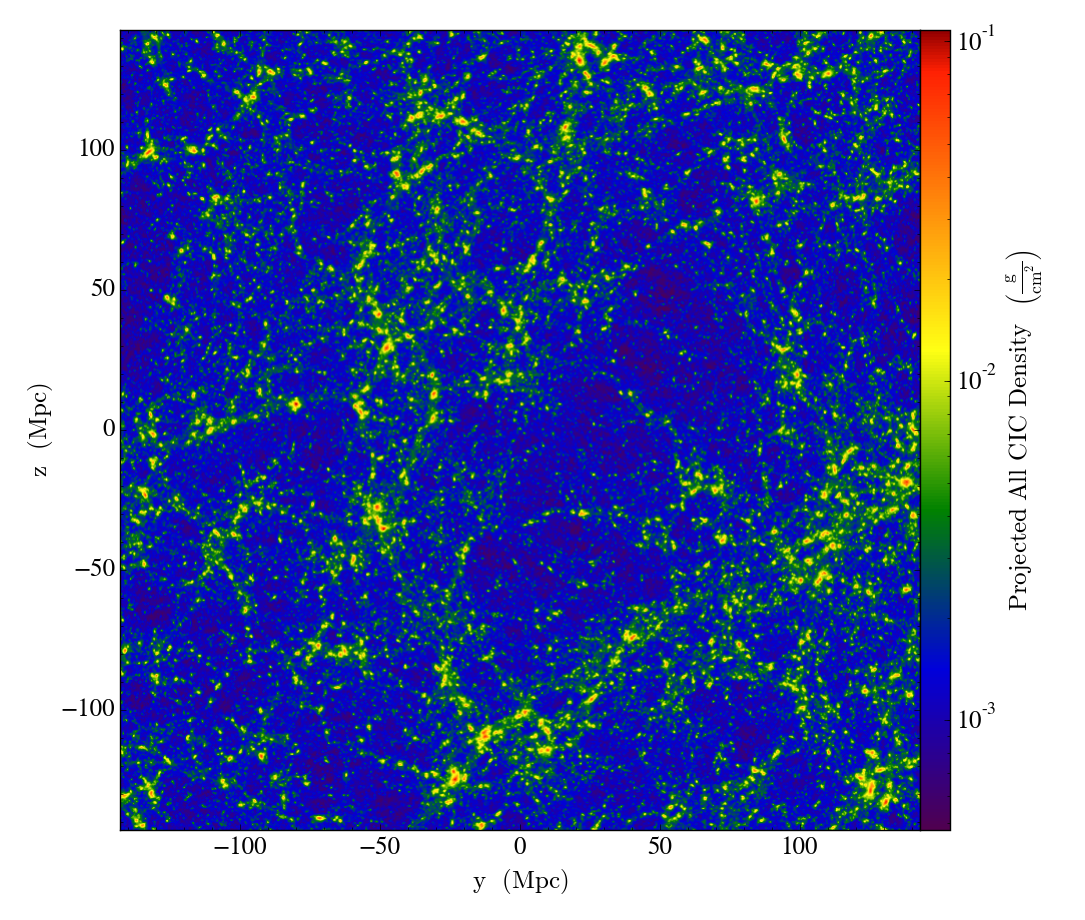
Visualization has proved important in our own research as well. Simple sanity checks on the large-scale structure of our simulations helps us make sure our simulations are running properly. Plots of different parameters show simple relationships that arise from the physics of our simulations.